Industrial space in Berlin
28.90 %
Commercial enterprises
22.20 %
Logistics service providers
33.30 %
Industry / production
Retail remains the strongest sector in terms of take‑up, with 182,400 m² and a market share of 42 percent. Followed by companies in the industrial and manufacturing sectors, at 23 percent. Companies in the logistics services sector account for 22.2 percent of take‑up.
(Source: REALOGIS - Market report Berlin full year 2025; Copyright: REALOGIS)
(Source: REALOGIS - Market report Berlin full year 2025; Copyright: REALOGIS)
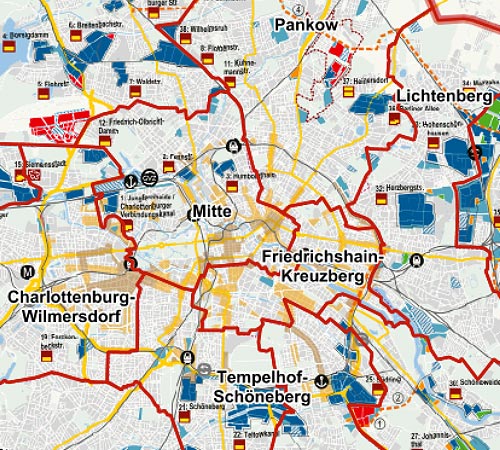
Urban Development Plan Economy 2040
With the decision of the Stadtentwicklungsplan Wirtschaft 2040 (Urban Development Plan Economy StEP Wirtschaft 2040), a framework was created to systematically consider potential locations and secure them for the long term. In the future, the aim is to achieve faster activation and better utilization of space. The development concept for the production-dominated area in Berlin (EpB), in its updated version, continues to be part of the urban development plan.